The SON is mounted in my Dawes Galaxy's front wheel. I mounted the wheel above my garage workbench using a couple of lengths of wood, with the tyre resting on the chuck of a small variable-speed modeller's lathe (i.e. using the chuck as a "rolling road").
The generator's output is connected to a home-made resistance decade box and the voltage is measured by a DVM, the frequency of the output is monitored by another multimeter. Monitoring the frequency is easier & more accurate than rigging up the bike computer for speed. 60Hz equates to approx. 35 Km/h or 20 MPH.
There may well be some inaccuracies in the values, as I had no way of checking for or compensating for distortion or clipping using only DMMs.
Here is a table of the voltage measurements at different speeds for differing loads (a 3W bulb would be 12 ohms):
Load (Ohms) |
|||||||||
Freq |
10 |
12 |
14 |
16 |
18 |
20 |
25 |
30 |
35 |
10 |
2.9 |
3.1 |
3.3 |
3.4 |
3.5 |
3.6 |
3.8 |
3.9 |
3.9 |
15 |
3.8 |
4.25 |
4.6 |
4.9 |
5.1 |
5.2 |
5.5 |
5.7 |
5.9 |
20 |
4.4 |
5 |
5.5 |
5.9 |
6.25 |
6.5 |
7.1 |
7.4 |
7.6 |
25 |
4.8 |
5.6 |
6.2 |
6.8 |
7.3 |
7.7 |
8.5 |
9 |
9.35 |
30 |
5 |
5.9 |
6.7 |
7.4 |
8 |
8.5 |
9.6 |
10.3 |
10.8 |
35 |
5.2 |
6.1 |
7 |
7.8 |
8.5 |
9.15 |
10.5 |
11.4 |
12.2 |
40 |
5.3 |
6.3 |
7.2 |
8.1 |
8.9 |
9.6 |
11.2 |
12.4 |
13.3 |
45 |
5.4 |
6.4 |
7.4 |
8.3 |
9.2 |
10 |
11.8 |
13.2 |
14.3 |
50 |
5.4 |
6.5 |
7.6 |
8.5 |
9.5 |
10.3 |
12.3 |
13.8 |
15.2 |
55 |
5.5 |
6.6 |
7.7 |
8.7 |
9.6 |
10.5 |
12.6 |
14.4 |
15.9 |
60 |
5.6 |
6.7 |
7.7 |
8.8 |
9.8 |
10.7 |
12.9 |
14.8 |
16.5 |
This translates into actual POWER output as so:
Load (Ohms) |
|||||||||
Freq |
10 |
12 |
14 |
16 |
18 |
20 |
25 |
30 |
35 |
10 |
0.8 |
0.8 |
0.8 |
0.7 |
0.7 |
0.6 |
0.6 |
0.5 |
0.4 |
15 |
1.4 |
1.5 |
1.5 |
1.5 |
1.4 |
1.4 |
1.2 |
1.1 |
1.0 |
20 |
1.9 |
2.1 |
2.2 |
2.2 |
2.2 |
2.1 |
2.0 |
1.8 |
1.7 |
25 |
2.3 |
2.6 |
2.7 |
2.9 |
3.0 |
3.0 |
2.9 |
2.7 |
2.5 |
30 |
2.5 |
2.9 |
3.2 |
3.4 |
3.6 |
3.6 |
3.7 |
3.5 |
3.3 |
35 |
2.7 |
3.1 |
3.5 |
3.8 |
4.0 |
4.2 |
4.4 |
4.3 |
4.3 |
40 |
2.8 |
3.3 |
3.7 |
4.1 |
4.4 |
4.6 |
5.0 |
5.1 |
5.1 |
45 |
2.9 |
3.4 |
3.9 |
4.3 |
4.7 |
5.0 |
5.6 |
5.8 |
5.8 |
50 |
2.9 |
3.5 |
4.1 |
4.5 |
5.0 |
5.3 |
6.1 |
6.3 |
6.6 |
55 |
3.0 |
3.6 |
4.2 |
4.7 |
5.1 |
5.5 |
6.4 |
6.9 |
7.2 |
60 |
3.1 |
3.7 |
4.2 |
4.8 |
5.3 |
5.7 |
6.7 |
7.3 |
7.8 |
(The figures in red indicate the peak power values at a given speed.)
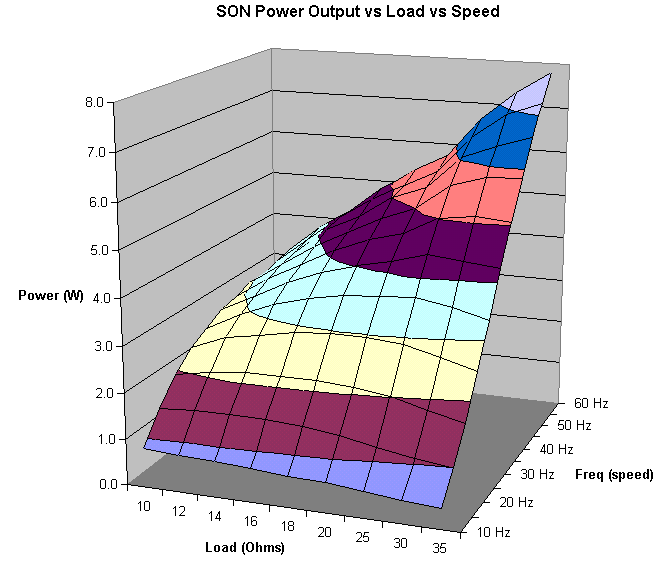
Now, using MS-Excel it's possible to map these figures into a nice fancy surface area chart:
If you look at the power curve for the 12 ohm load (3W bulb) you'll see it flattens off pretty good after 3W (remember the output will be snubbed anyway when a zener-equipped lamp is connected), so at the top speed measured here only 0.7W will be dissipated into the zener.
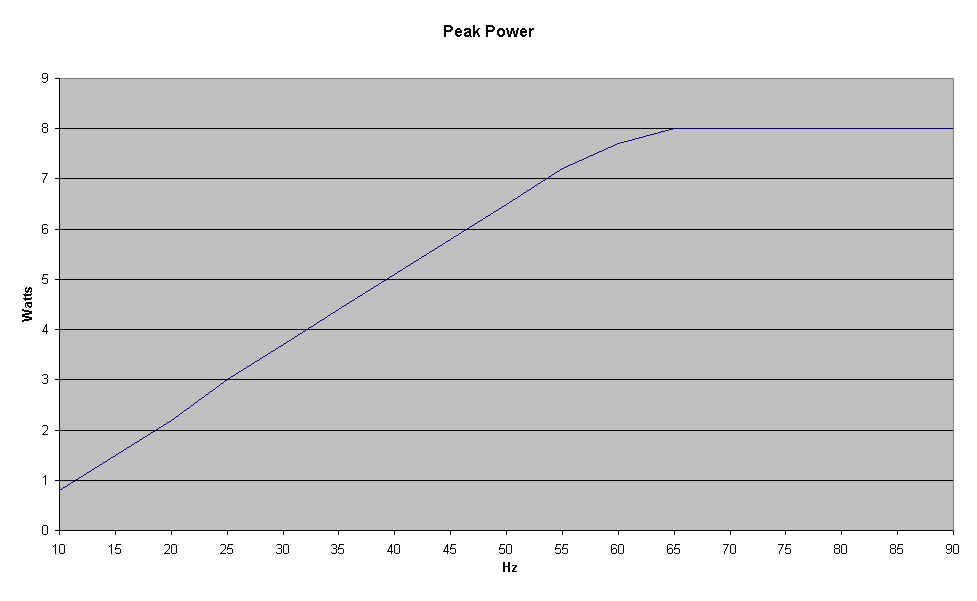
Note that the power vs. load appears to show a kink in the graph at 20 ohms - this is only due to the fact that the increments in load value changed from 2ohm to 5ohm steps at that point. If you interpolate the data and plot the PEAK POWER at given speeds, it's surprisingly linear.
At the moment I am (slowly) working on a PIC-based tracking regulator to drive two 2.4W bulbs and use the spare power to charge a battery for a standlight. Meanwhile I hope the figures are of use to anyone else considering tinkering with this generator.